
Evaluate statistics in the Web desk
The eight pages of statistics – from sales to control.
Under Statistics in the Web desk , you can see how your business is performing. The figures come directly from your POS system and correspond to your Z-reports. Select a page at the top, and the time period using Filters.
Overview, Sales, ** item**, Staff, and Control are available in every plan. Starting with Solo, the full statistics are included: Time & Channels, Service & Guests, Branches, Outlook, and "Ask your numbers." Employees need the permissions **Use Web desk ** and View Overview & Statistics, and for the Staff page, they also need Employee Evaluation. Branches are only visible to those with multiple locations. Upon first access, the owner sets up the statistics using a short wizard.
The pages
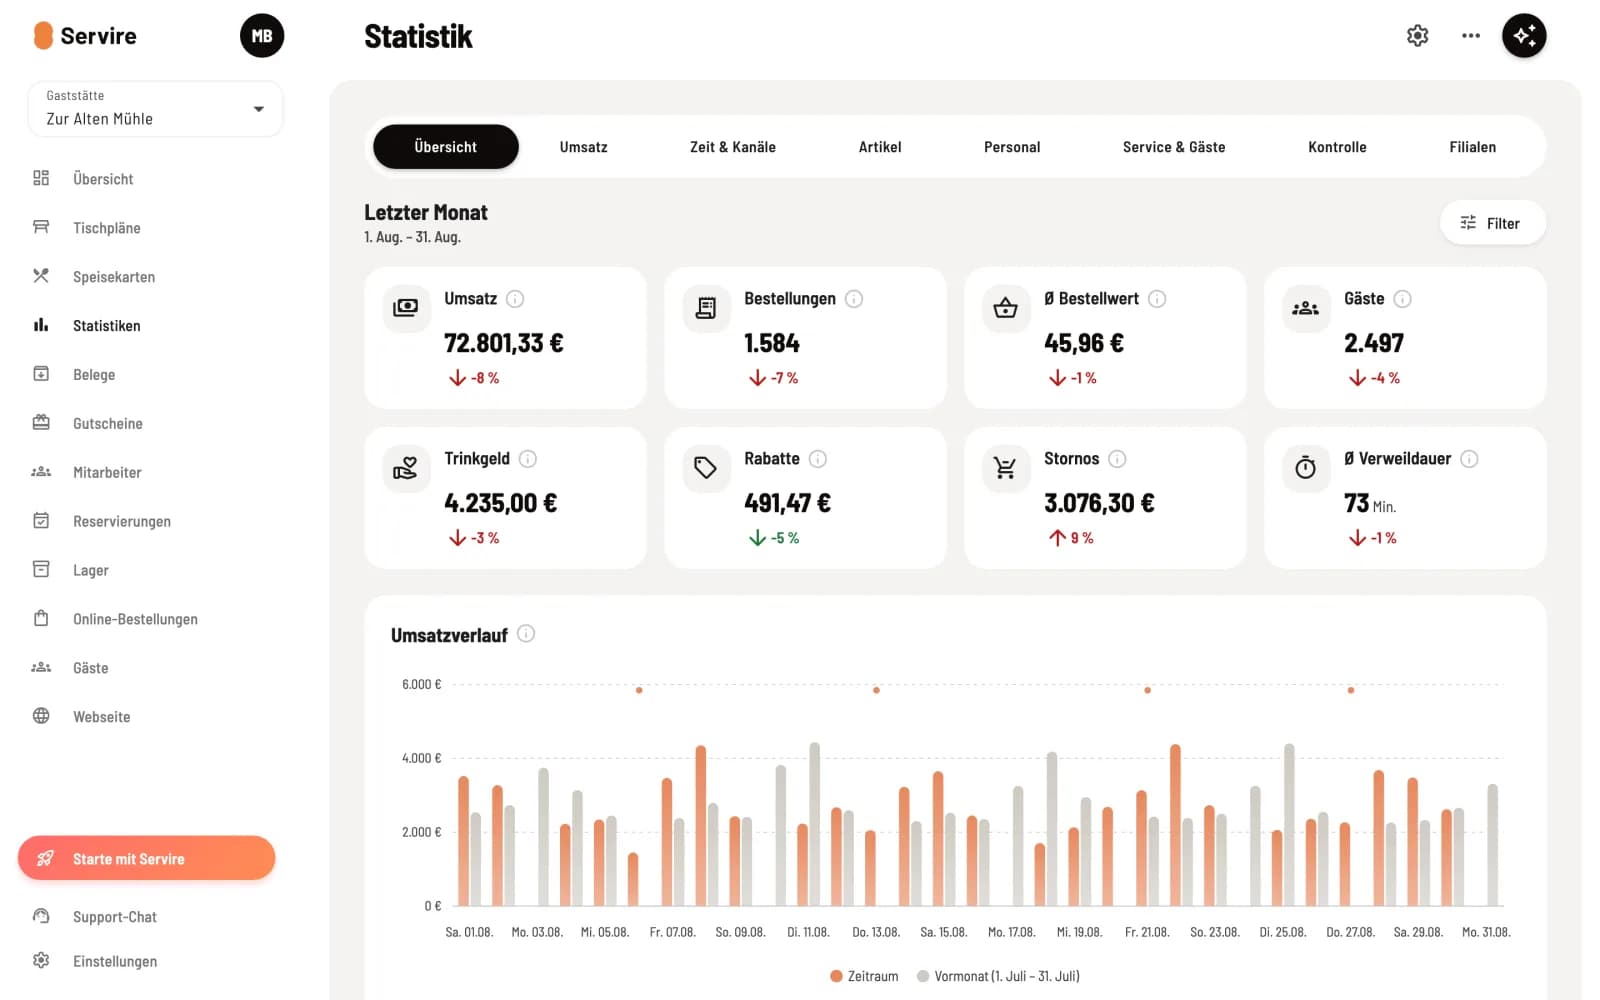
Step 1 of 8
Overview
Key figures with changes compared to the same period last year: revenue, orders, average order value, number of guests, tip, discounts, cancellations, and average session duration. This includes revenue trends, daily time periods, channels, payment methods, and top-selling item.
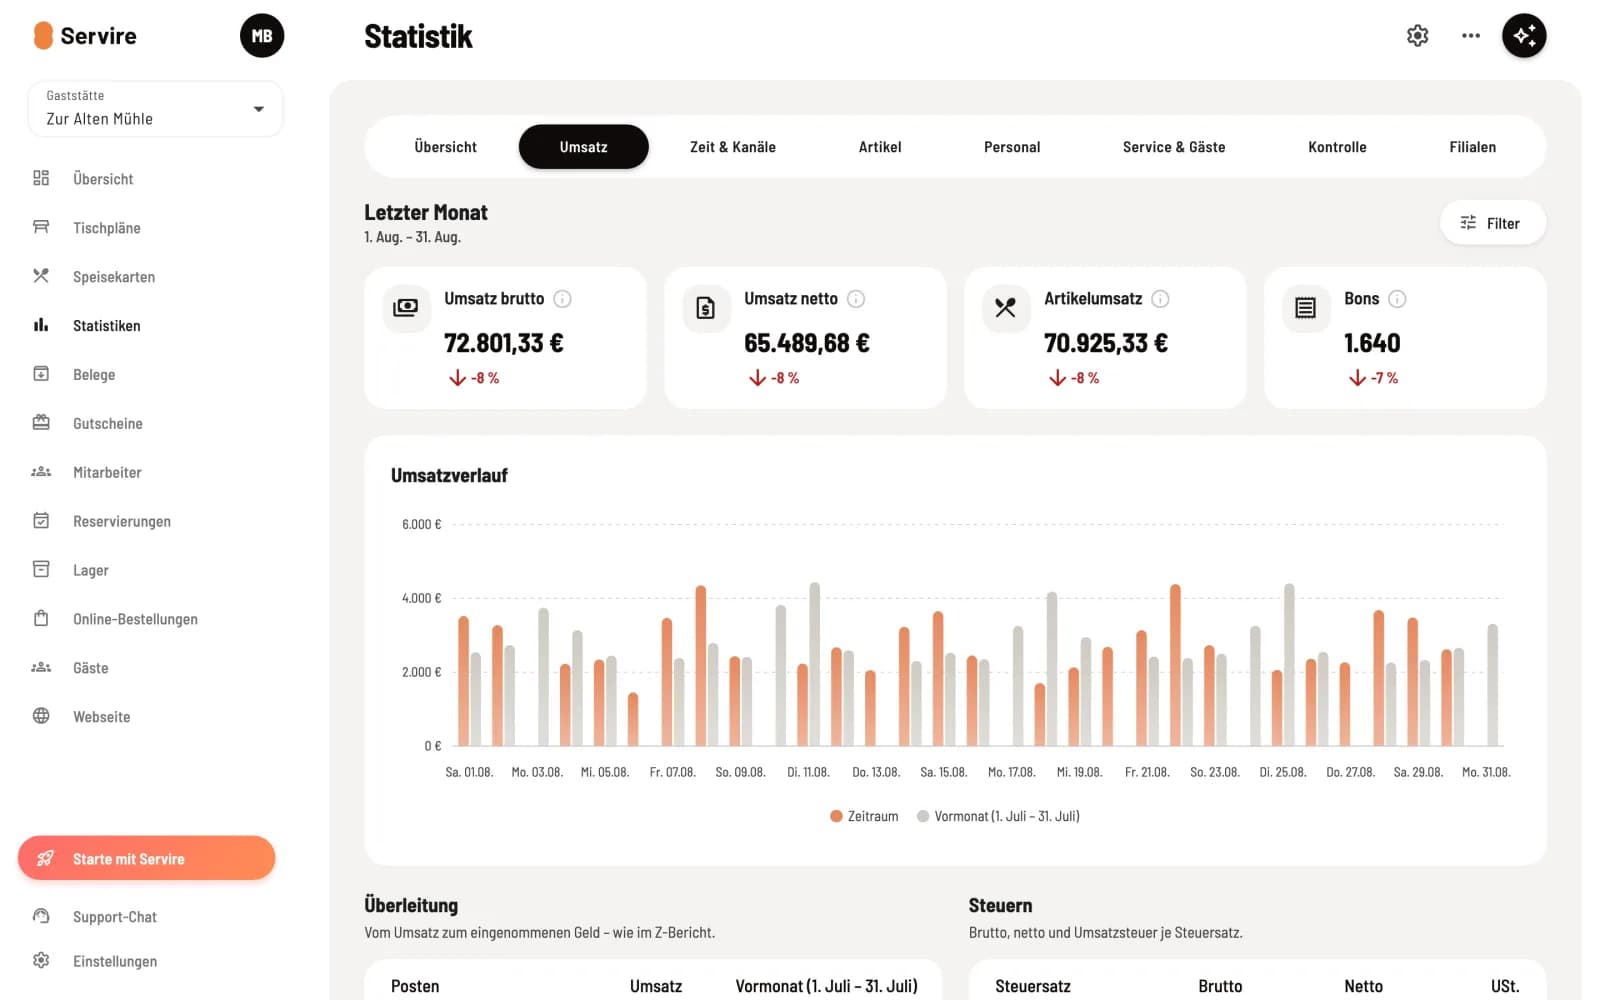
Step 2 of 8
Sales volume
Sales as in the Z-report: reconciliation to cash flow, taxes per tax rate, payment methods, product groups as well as areas and tables.
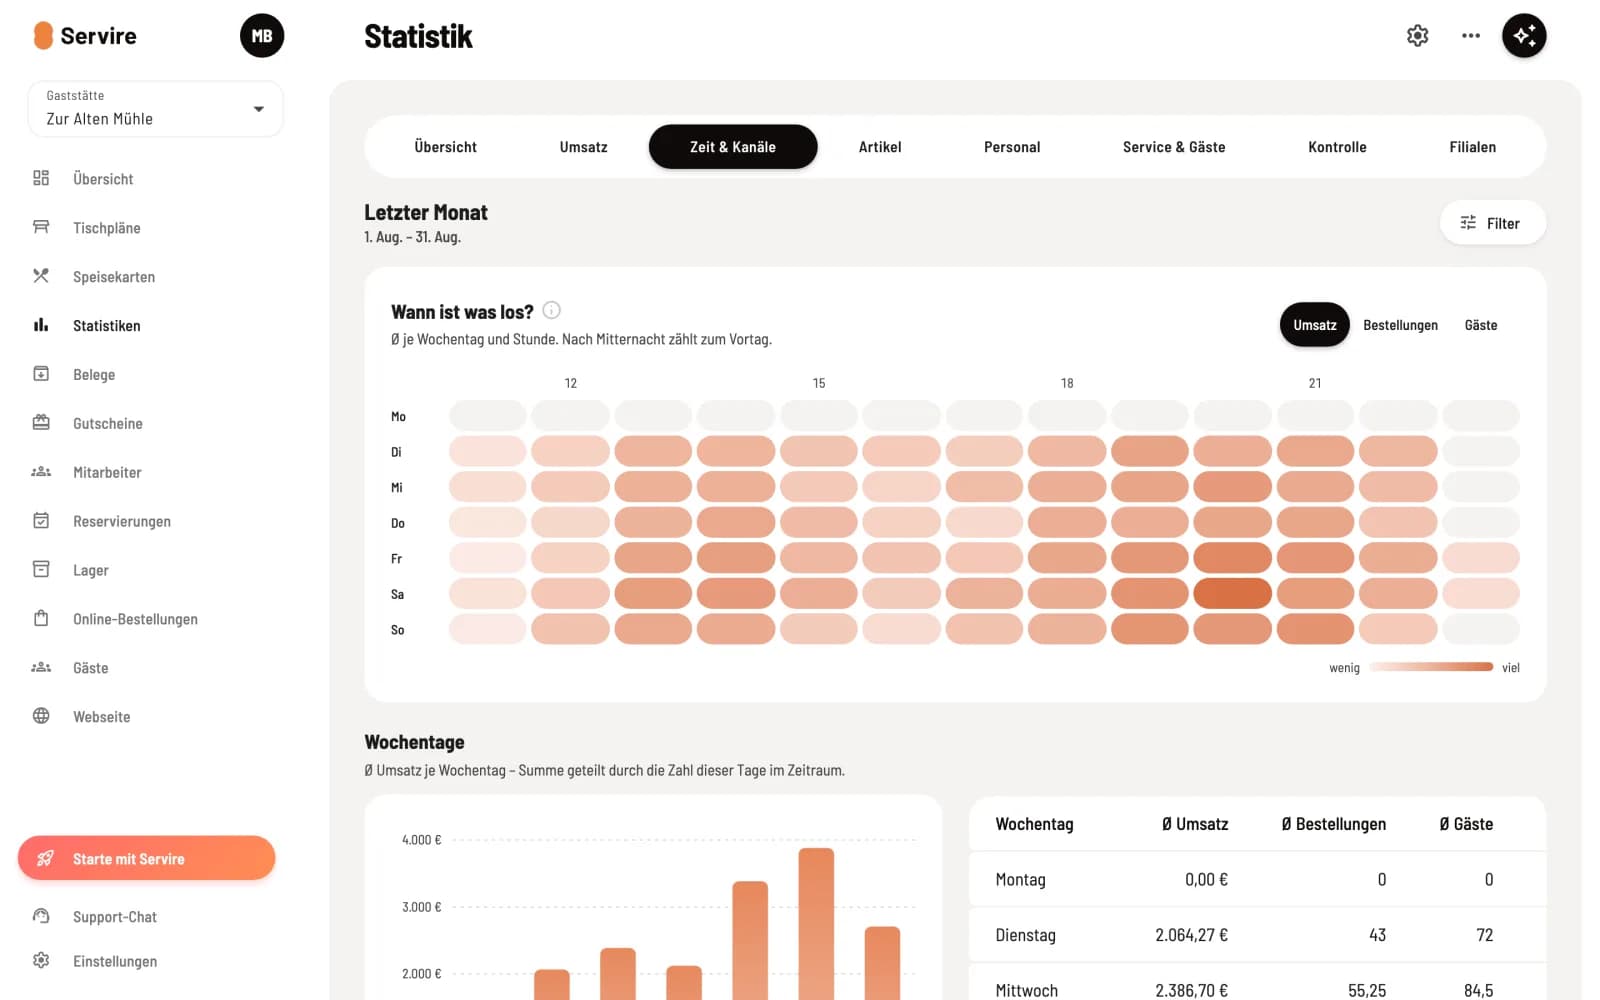
Step 3 of 8
Time & Channels
The heatmap shows which day of the week is busiest at which time. It also includes weekdays, time of day, channels such as table service, counter, takeaway and online, as well as sales by time of day.
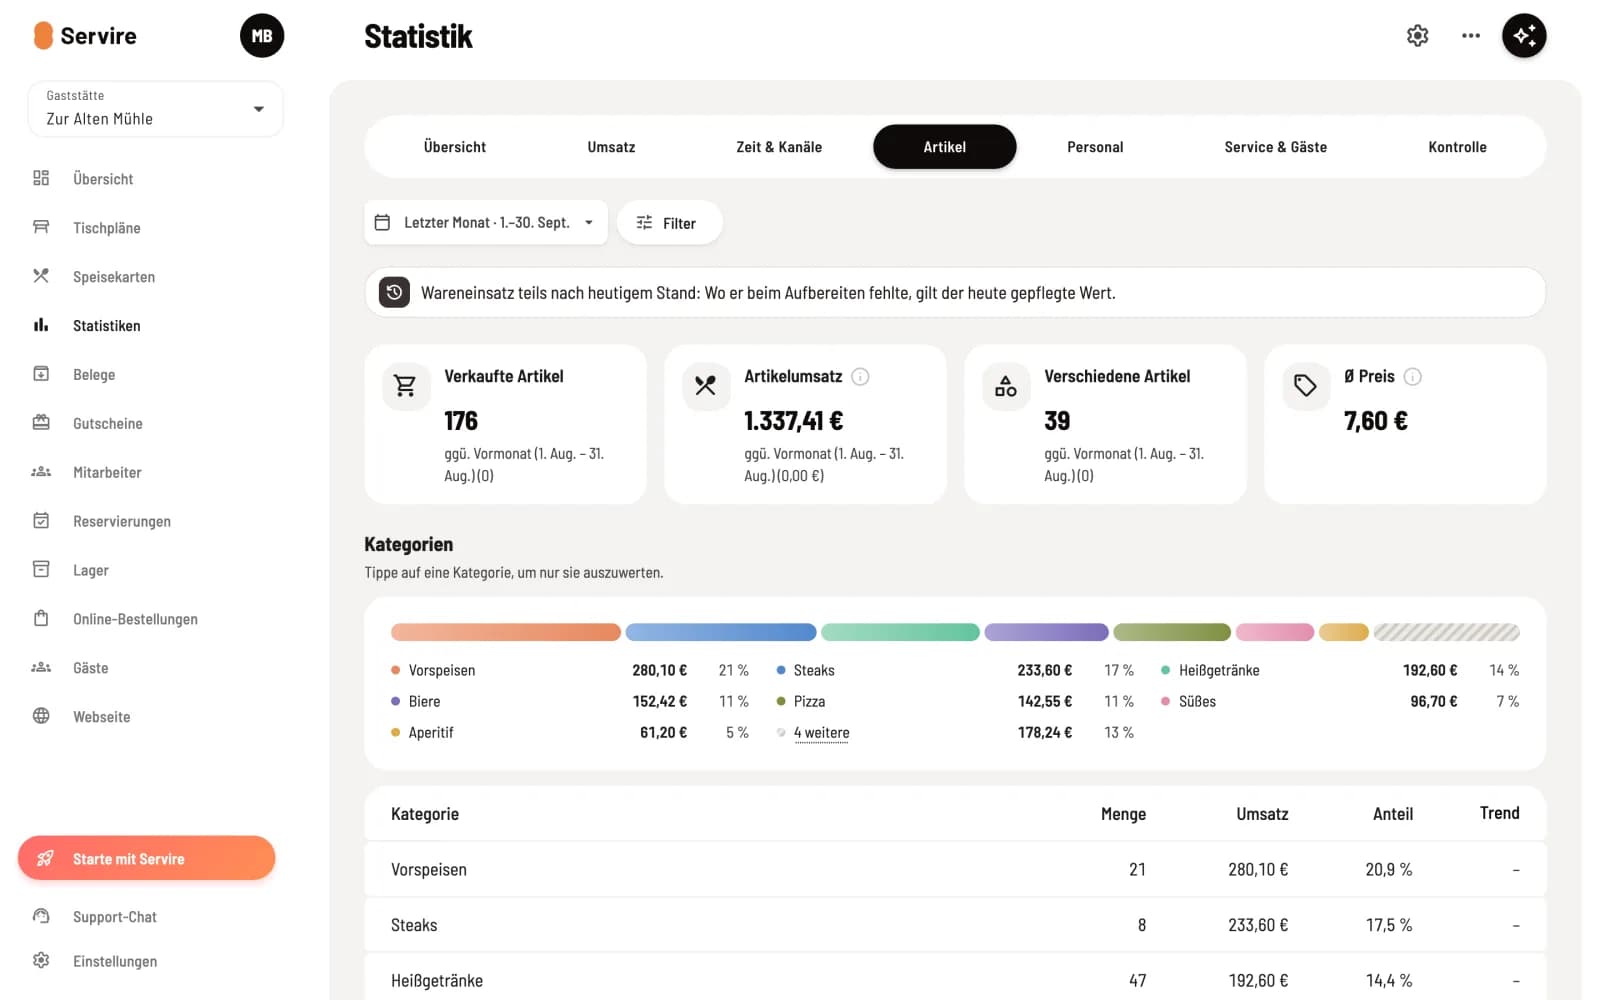
Step 4 of 8
item
Quantity and revenue per category and item , including trends. Clicking on a category displays only that category. Revenue from a category that no longer exists is shown under "Deleted Category." Starting with Solo, the menu matrix, "Frequently Ordered Together," and a item profile are also included.
Step 5 of 8
staff
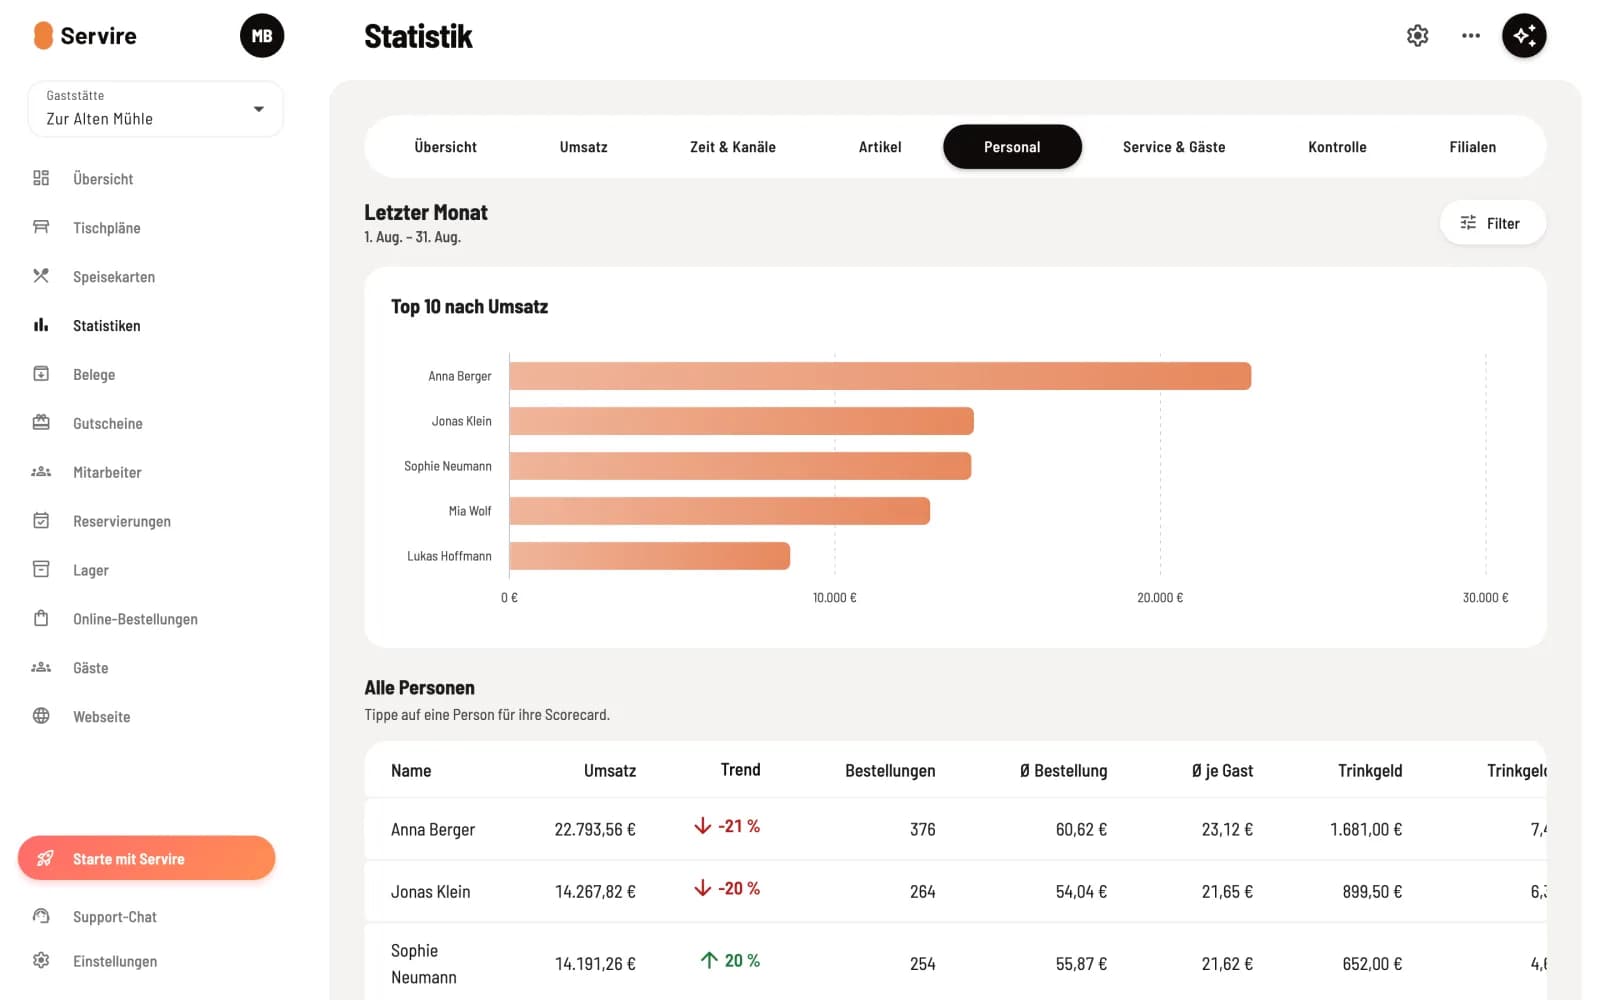
Sales, orders, tip, cancellation and discount rates per person, plus the team average. Clicking on a person opens their scorecard (starting with Solo).
Step 6 of 8
Service & Guests
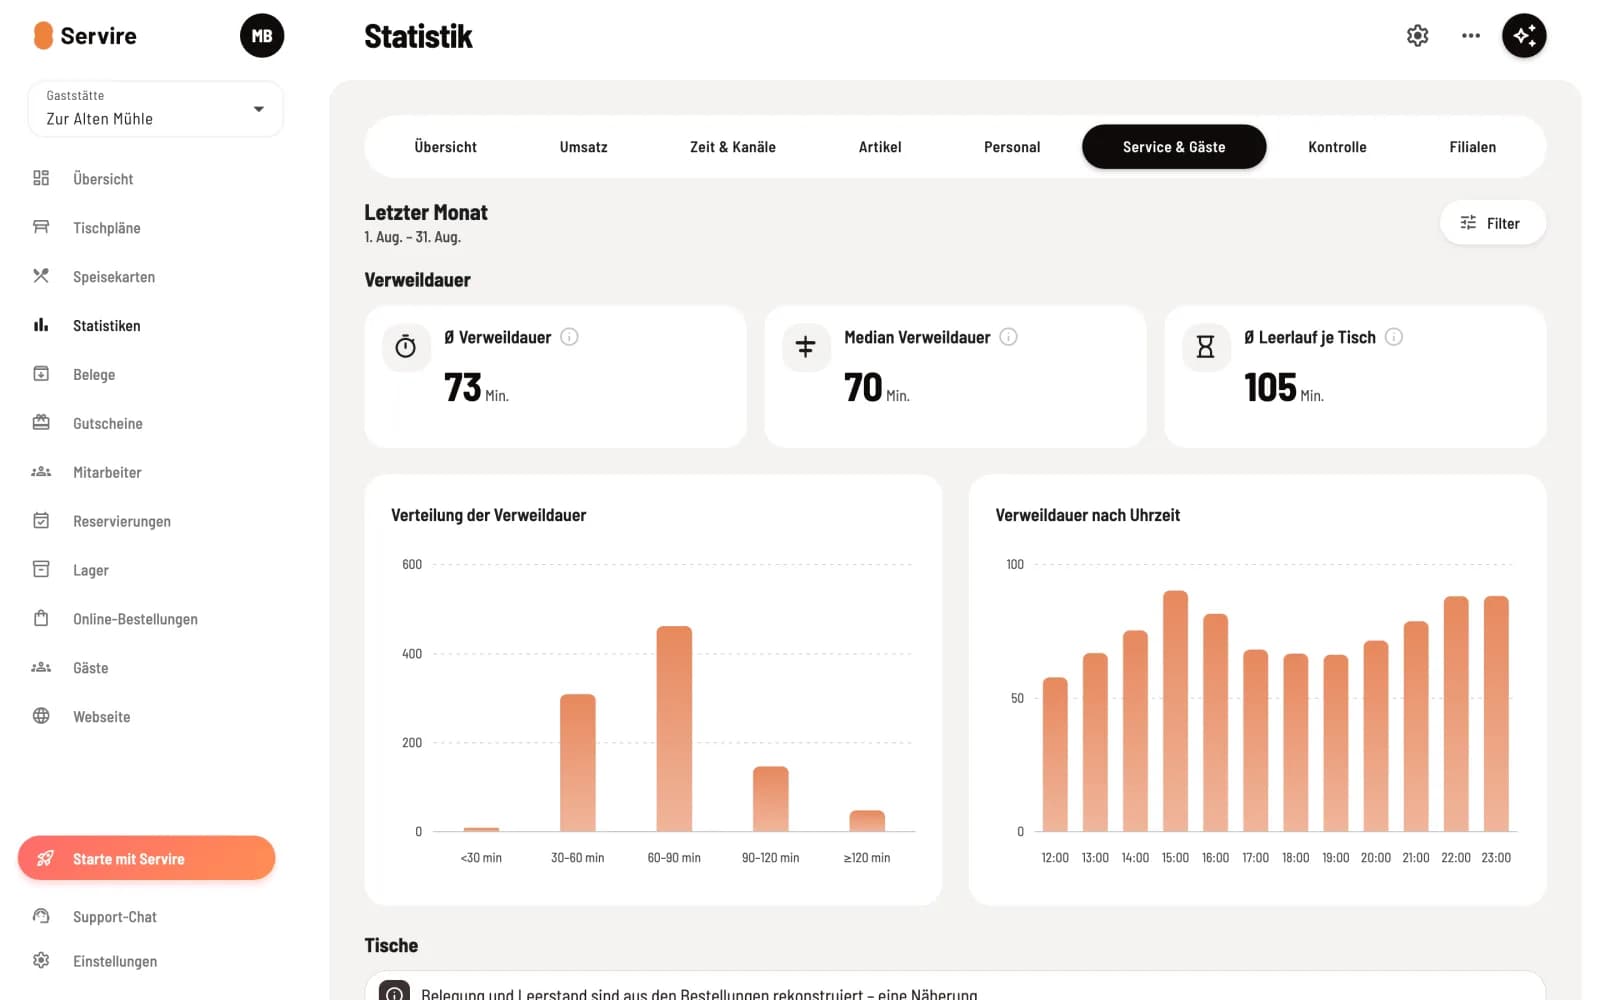
Length of stay, table occupancy, reservations and no-shows, pickups and kitchen activity, as well as new and regular guests. The kitchen measures the time until ready to serve or finished for each item in the kitchen monitor, including peak kitchen times: Evaluate kitchen times. Reservations and no-shows are only counted with the Reservations module (Max plan).
Step 7 of 8
control
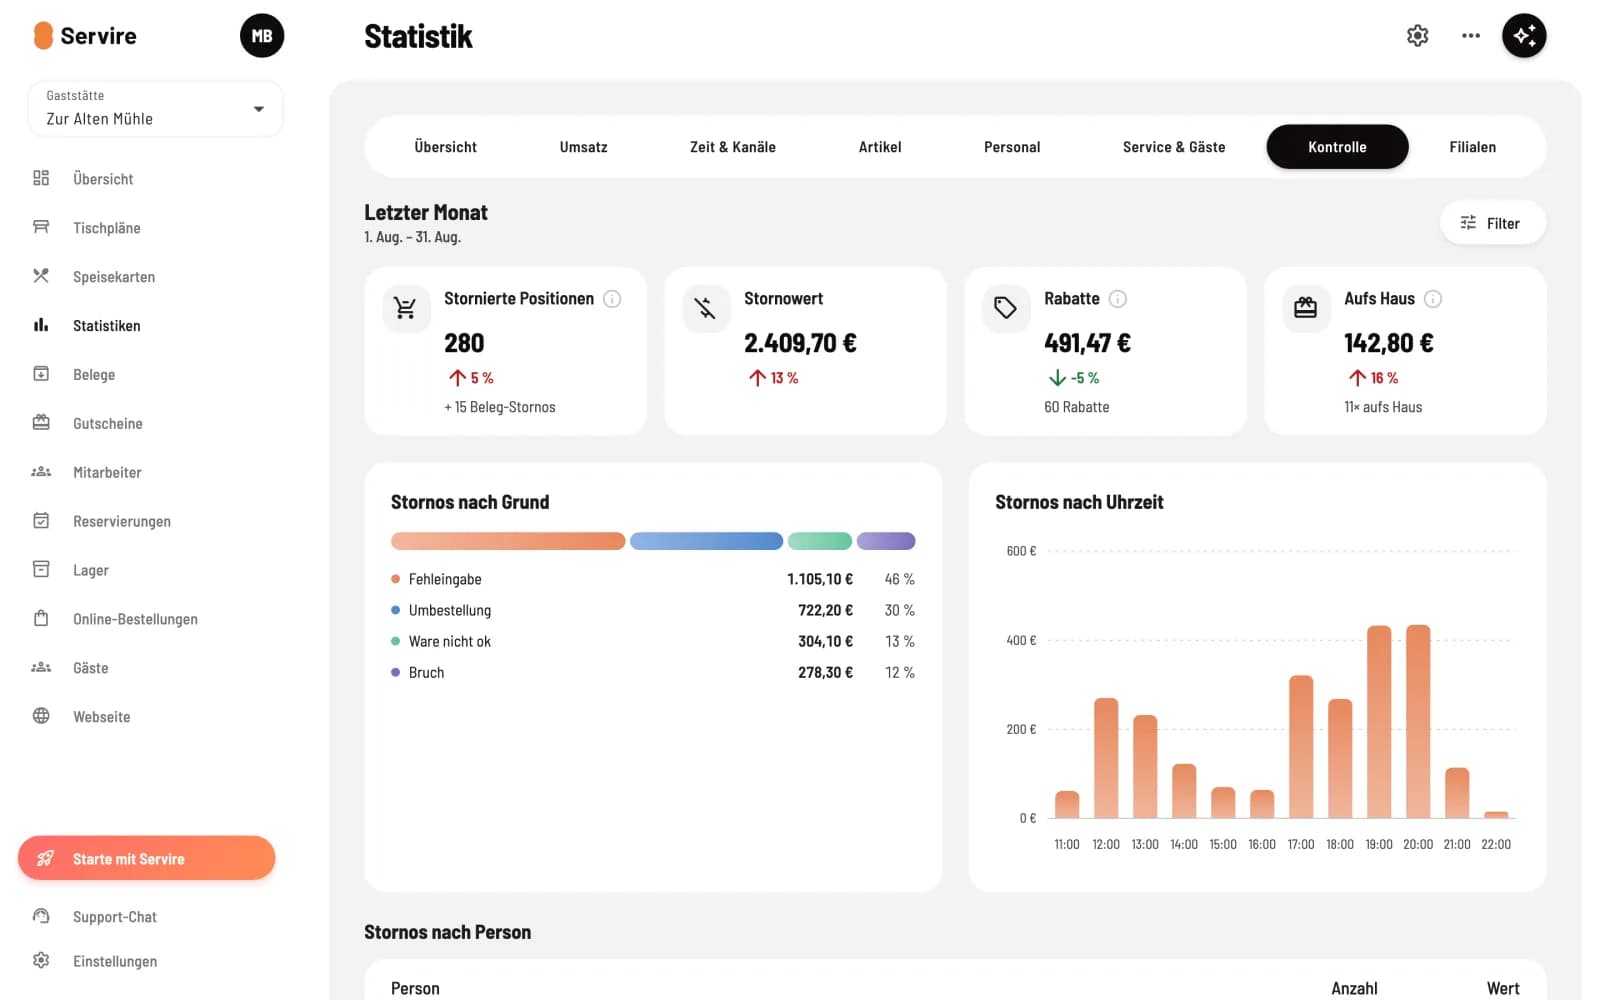
Cancellations and discounts, each switchable: Overview shows cancellations by reason and time and discounts by type; Individual shows each cancellation and each discount with time, item, reason, and person. Also includes cancellations and discounts per person, "on the house" offers, vouchers, cash register discrepancies, and the service registers of each shift.
Step 8 of 8
branches
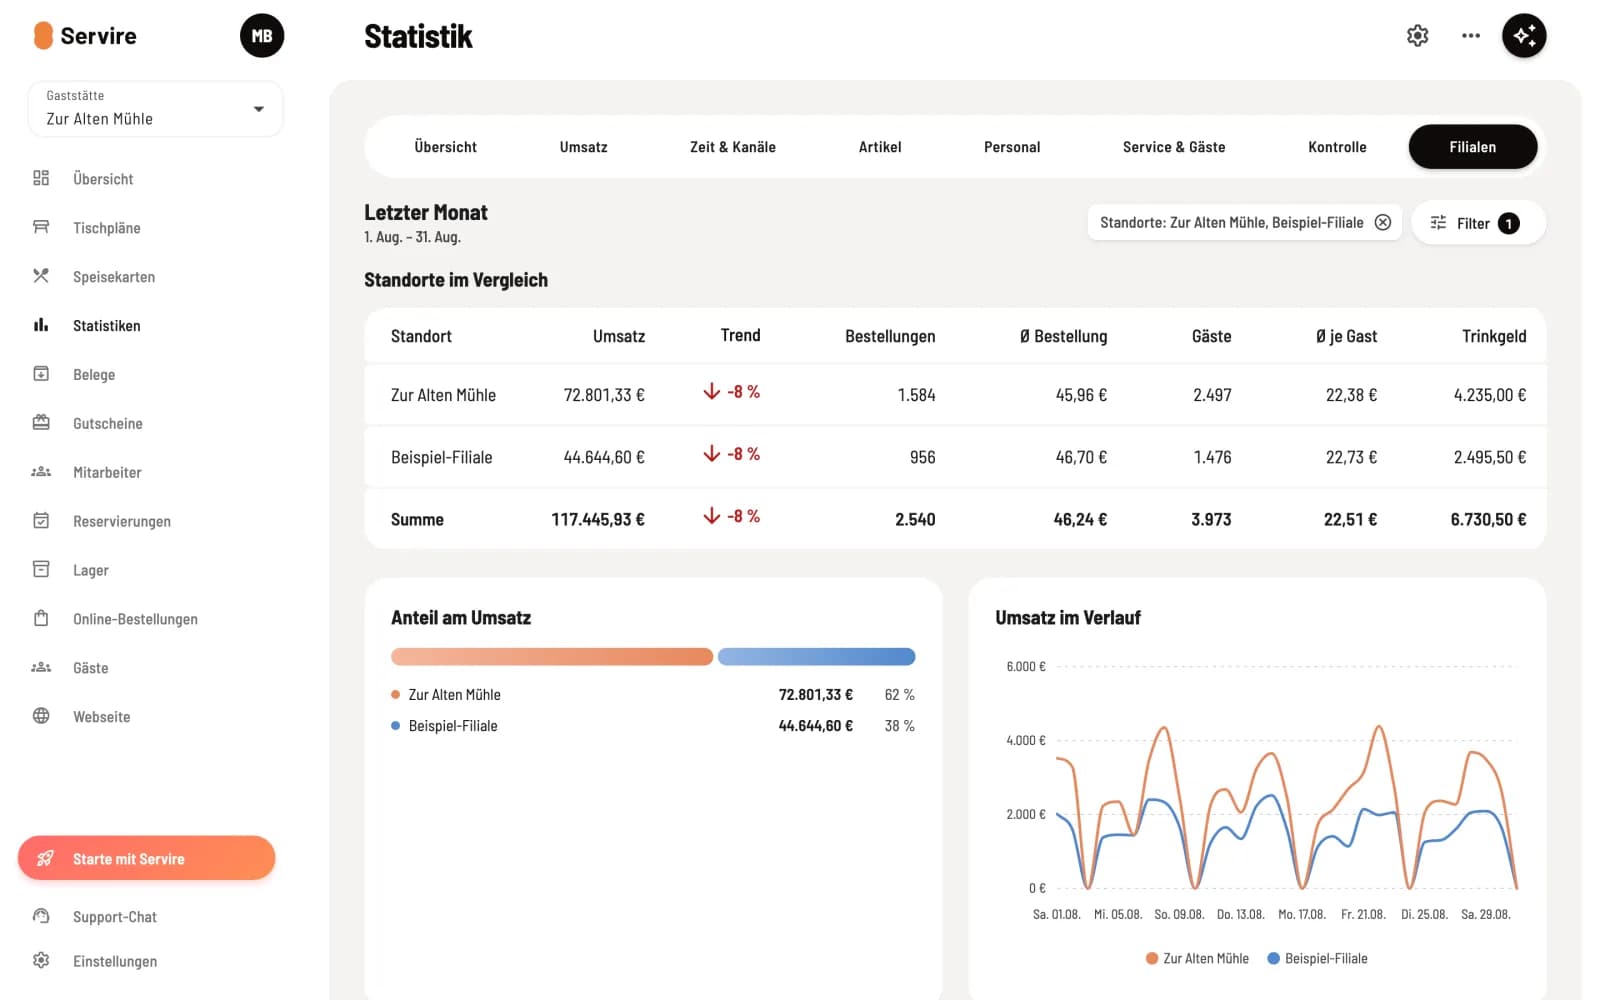
Multiple locations side by side. You can select which ones to compare under Filter → Locations.
Share bars show a maximum of seven items individually. The rest are summarized at the end, for example as "50 more". Hovering your mouse over them displays the five largest. If there's a table below, such as in the categories on the ** item** page, clicking on it will expand it completely.
The info symbol next to a number explains how it is generated.