Statistics settings and privacy
Daily time slots, goals, pace instructions for the cash register, recognition via payment card and industry comparison.
You can access the settings via the gear icon at the top of the statistics. They apply to the entire operation.
Step 1 of 4
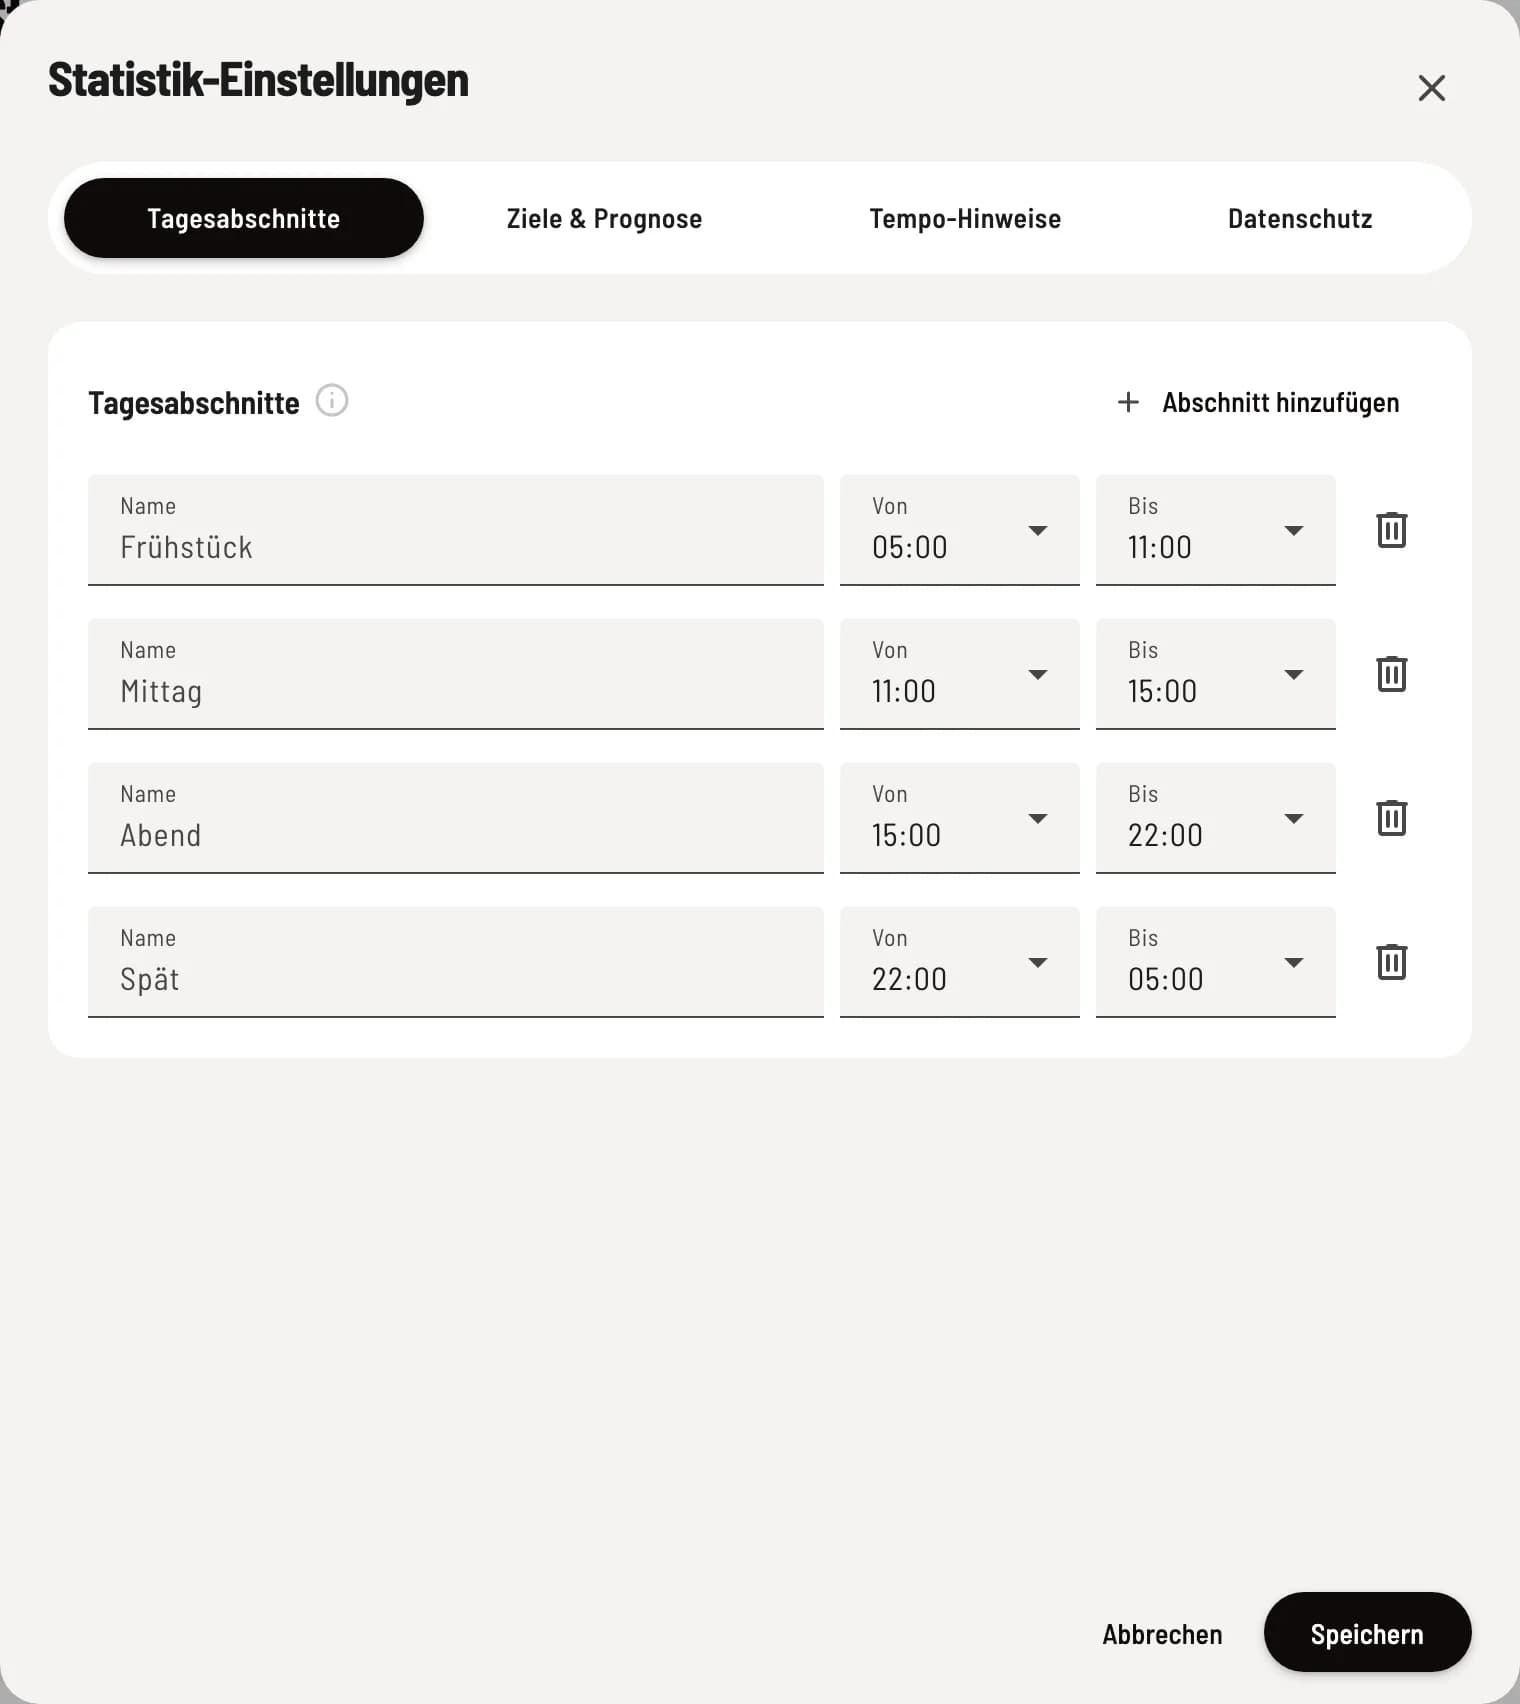
Time of day
Divide the day according to your company's operating schedule, for example, breakfast, lunch, dinner, and late evening – up to eight sections. These apply to filters, heatmaps, reports, and forecasts.
Step 2 of 4
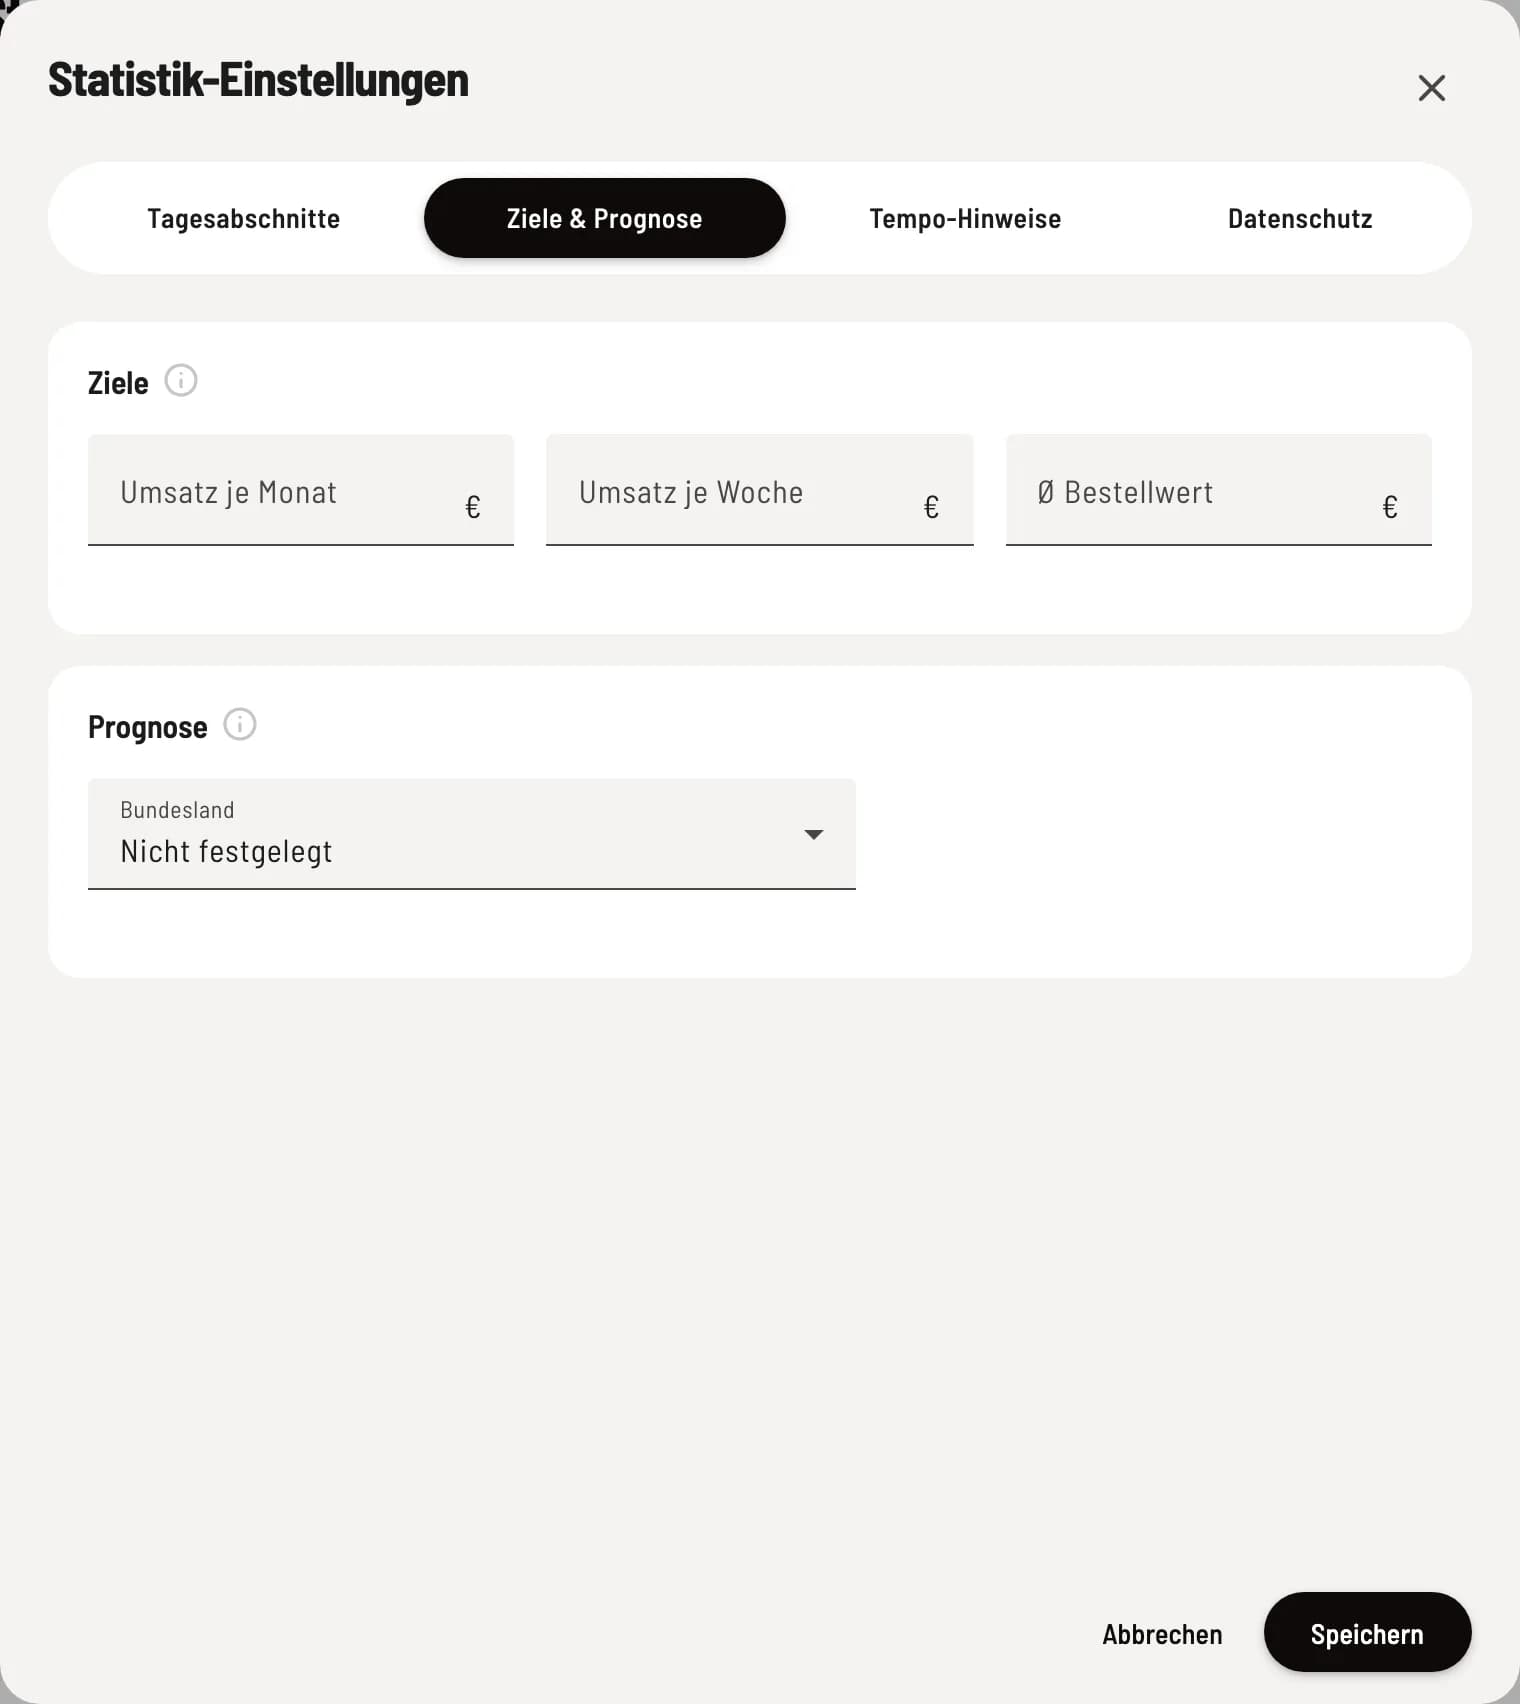
Goals & Forecast
Sales targets per week and month, and a target for the average order value. The federal state determines the public holidays: The forecast treats a public holiday as a Sunday.
Step 3 of 4
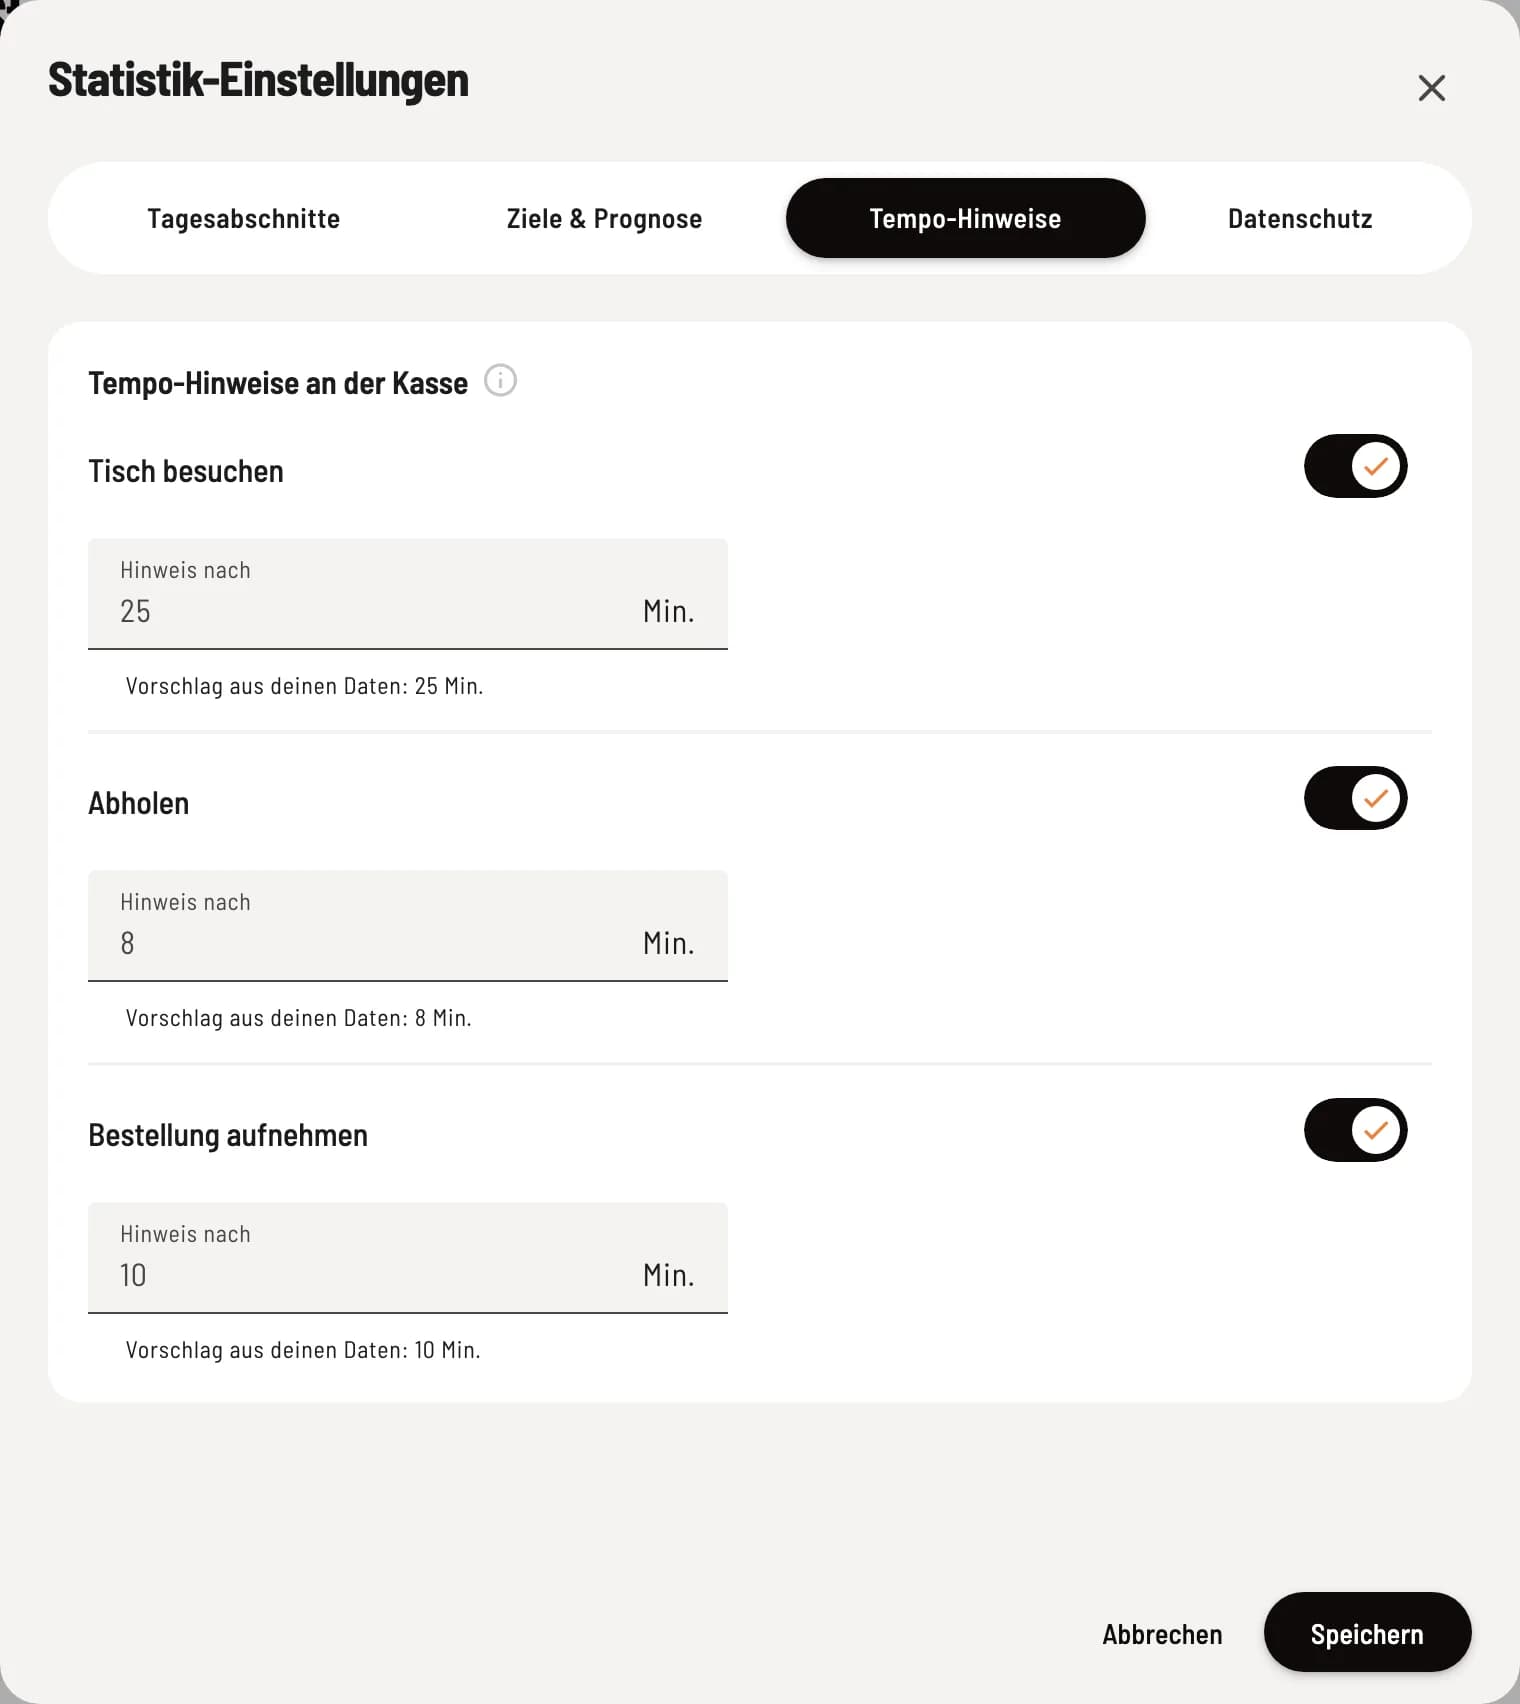
Speed guidelines
The table plan at the checkout will display a notification for: Visit table, Pick up, and Take order. Servire suggests the minutes each night based on your data; you can disable each notification or enter your own time. The tab will be available the night after setup.
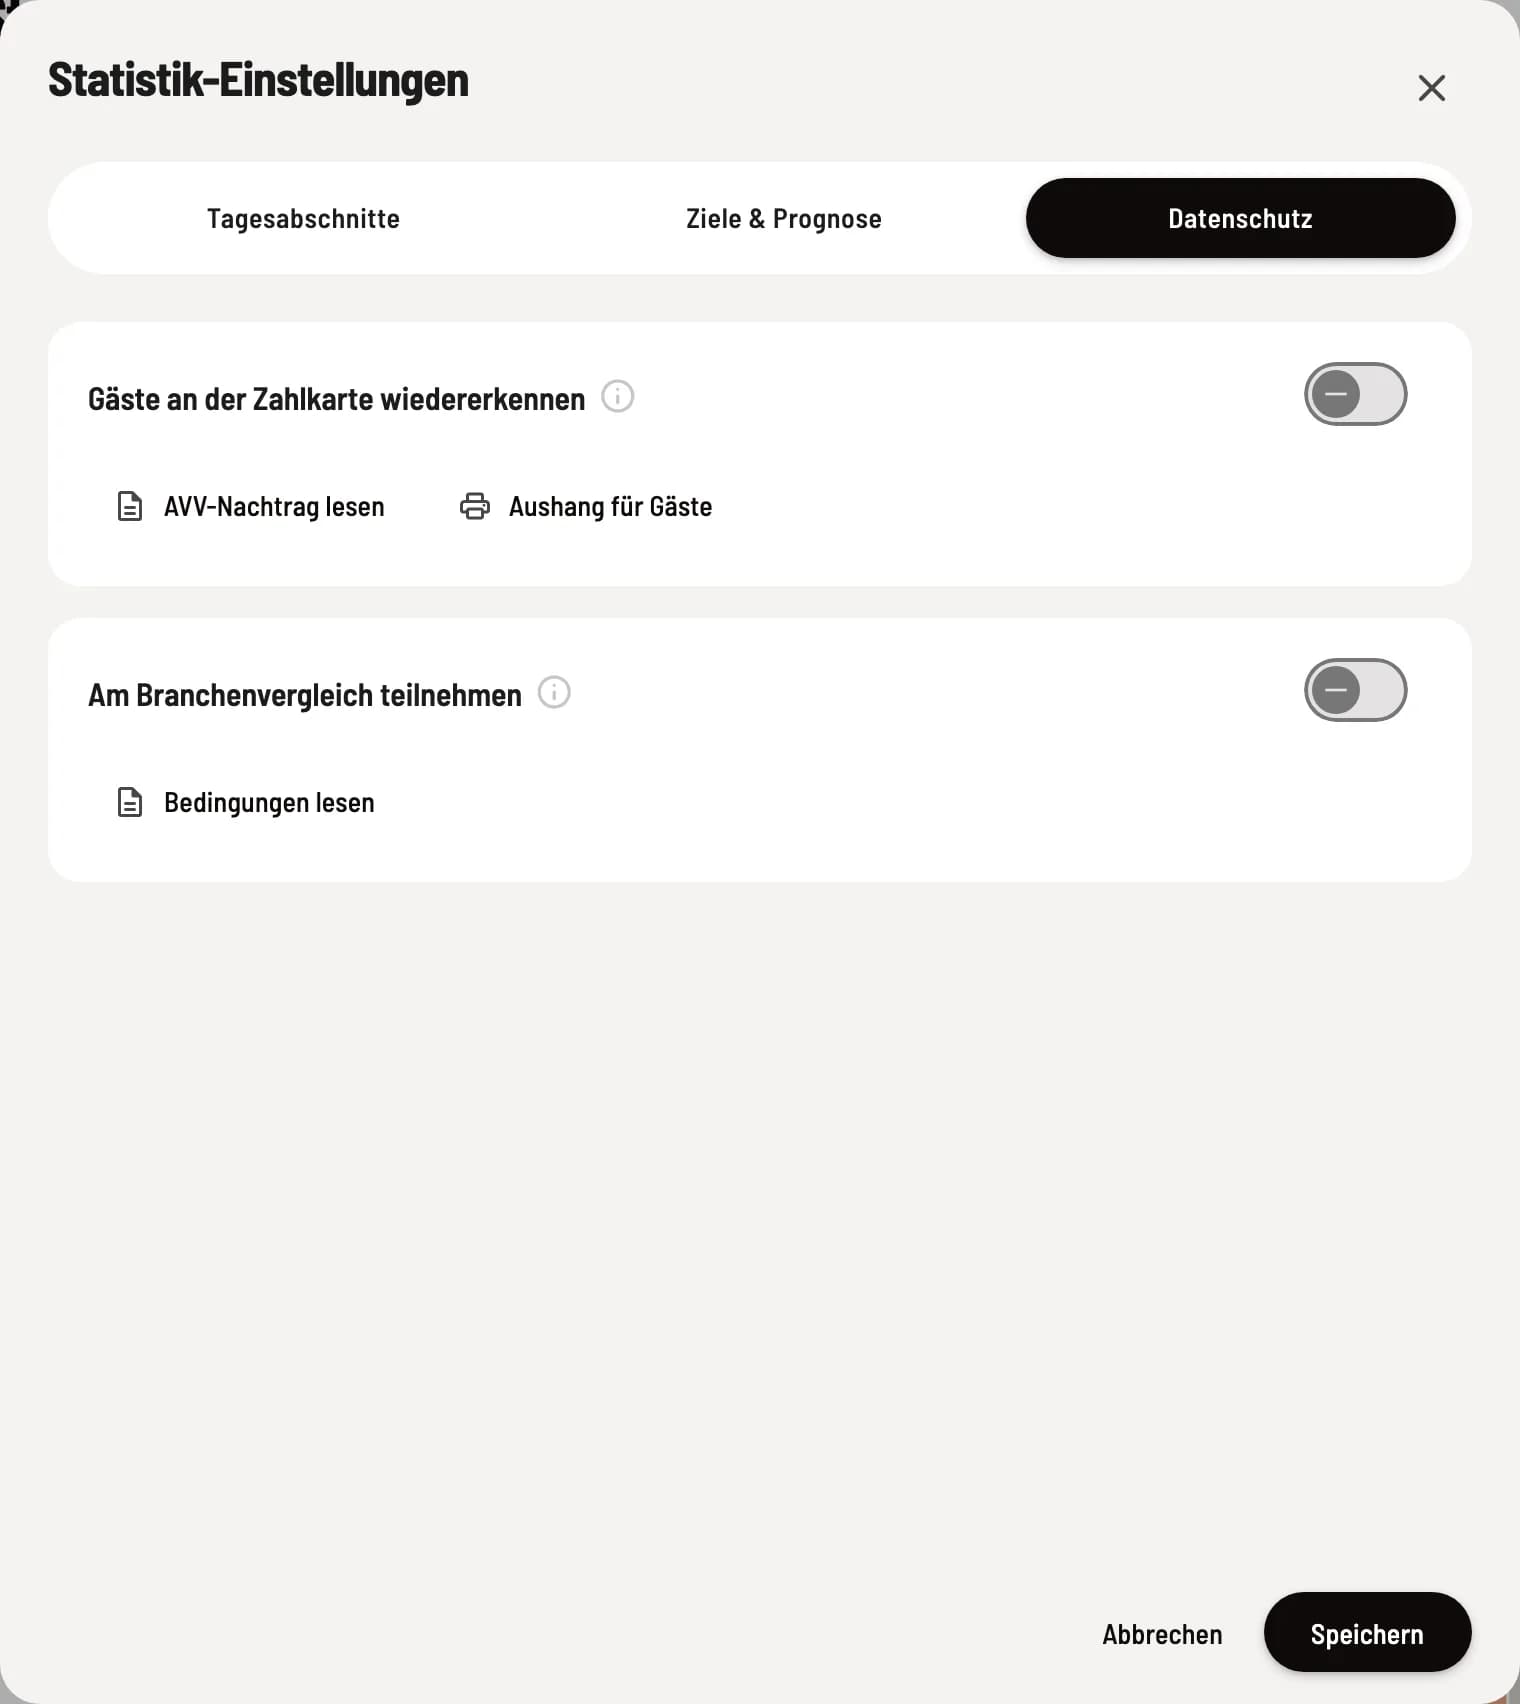
Step 4 of 4
Data protection
Card recognition and industry comparison are available with Max. Only the cardholder can activate them.
Recognize guests by their payment card
To enable Servire to display regular customers and return rates, it stores an encrypted card identifier for Stripe and Zettle payments – never the card number. SumUp does not provide an identifier. Upon activation, you accept an addendum to the data processing agreement; you can download the notice for guests here. If a guest objects, select Object to recognition under Receipts → Invoices on the receipt.
Industry comparison
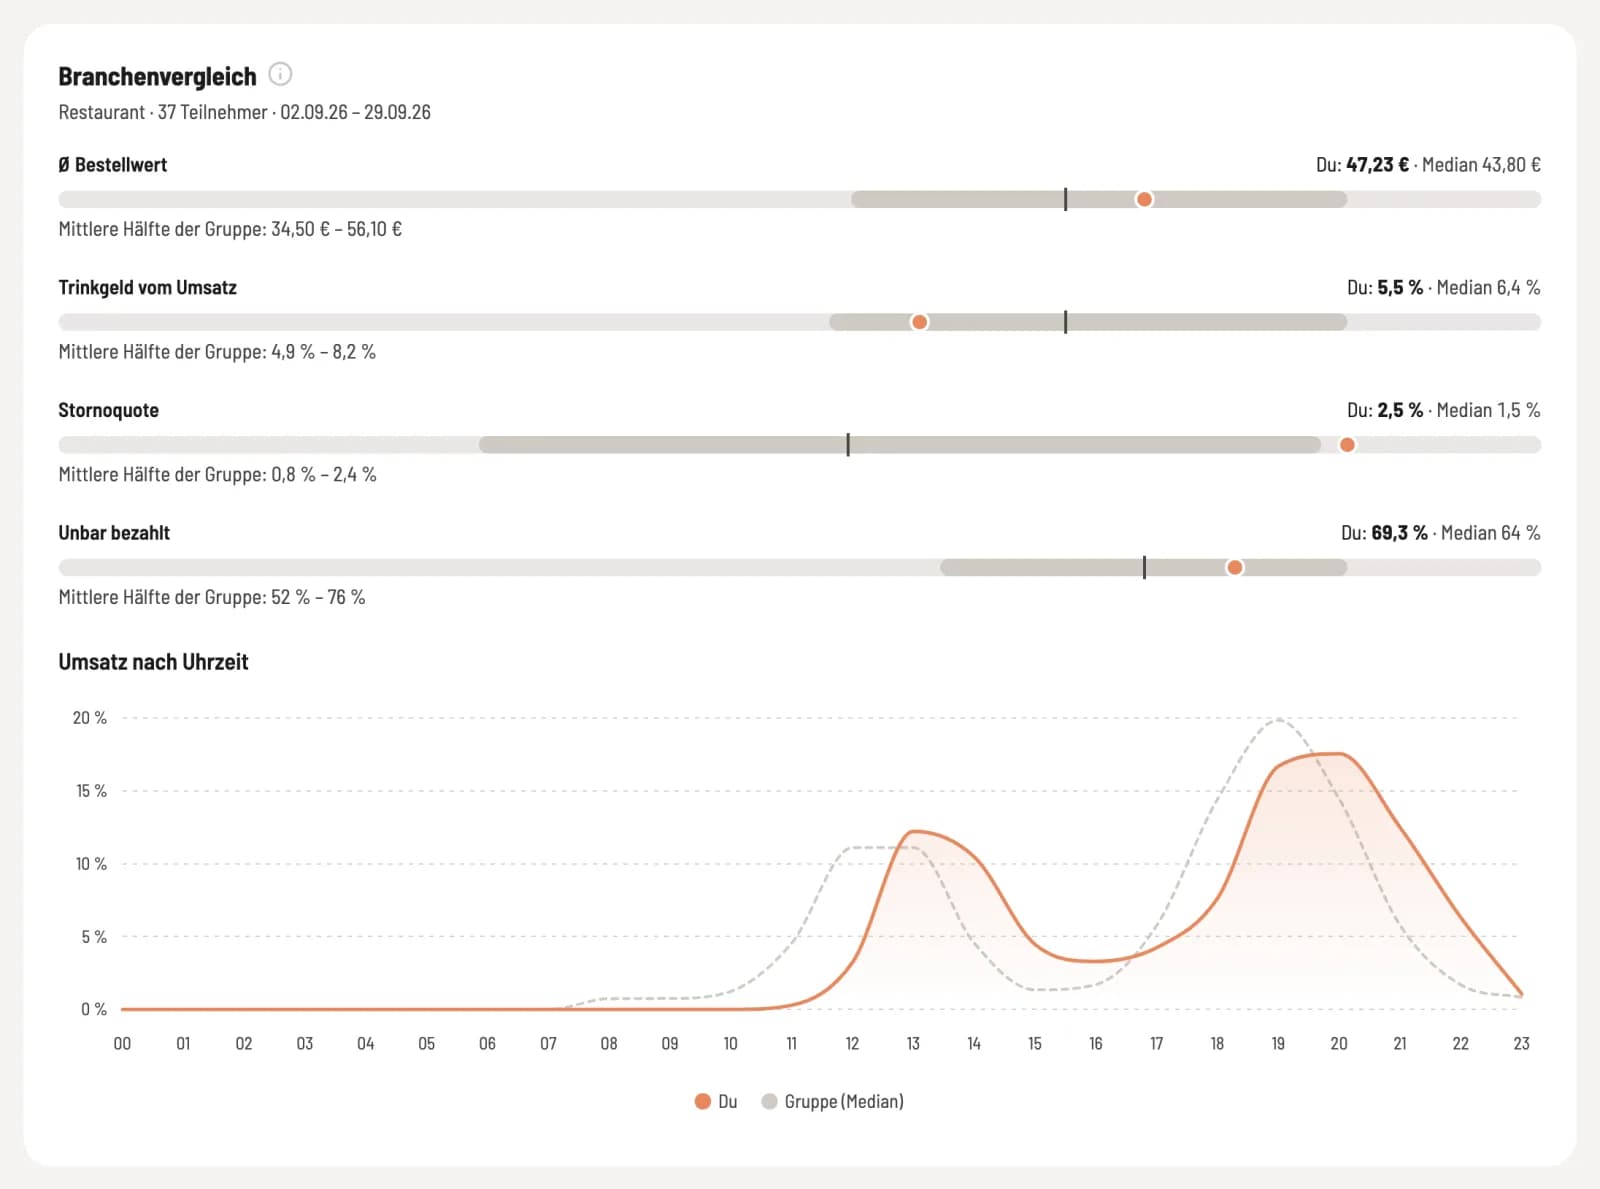
If you participate, the overview will show your values from the last 28 days alongside anonymous values from businesses of the same type (café, restaurant, or bar). Group values will appear once at least ten businesses are participating.