
This is how the statistics are calculated: revenue, Z-report and cash flow
What counts as revenue, how it translates into cash flow, and why the figures fit the Z-report .
The statistics use the same receipts as your Z-reports. Without filters, a day, a week, or a month will therefore show the same revenue as all the Z-reports for those days combined.
What counts as revenue
Sales is the taxable gross sales as in the Z-report: all item sold after discounts, plus taxable tip. Cancelled receipts have already been deducted. Deposits, sold multi-purpose vouchers, and tax-free tip are not included.
From revenue to cash flow
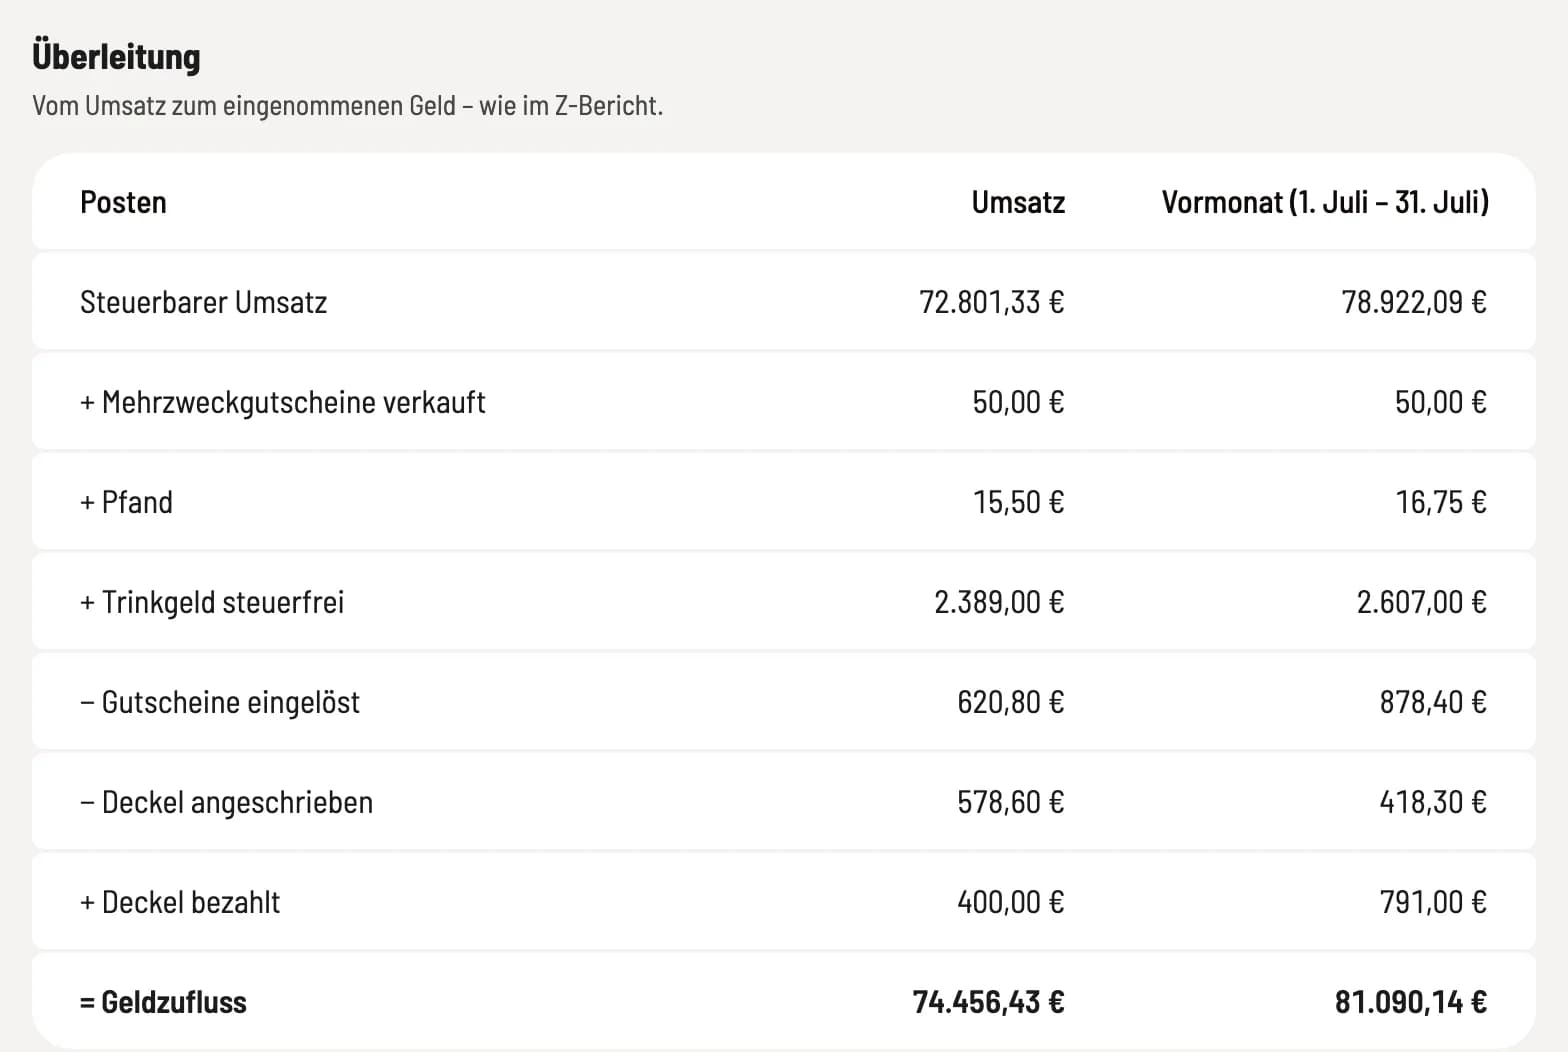
Step 1 of 3
Transition
On the Sales page: Taxable sales include sold multi-purpose vouchers, deposits, and tax-free tip. Redeemed vouchers and marked-up lids are deducted, while paid lids are added. The result is the Cash Inflow – the money that actually came in.
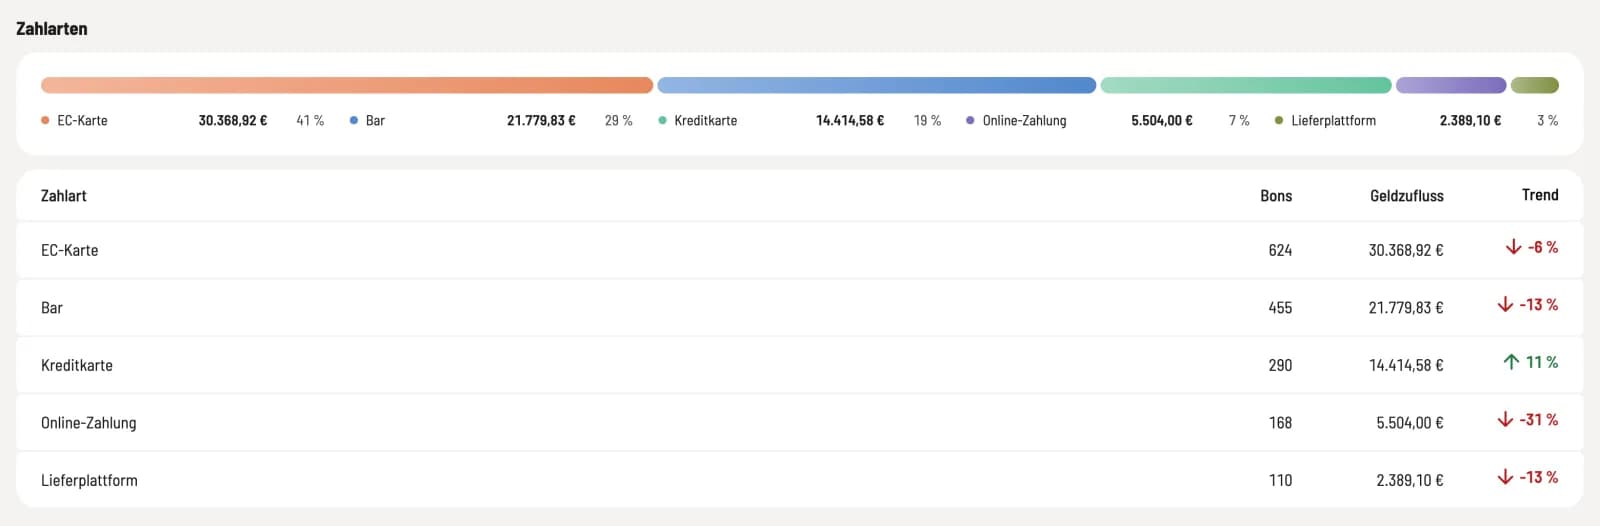
Step 2 of 3
Payment methods
The cash inflow is distributed across your payment methods. That's why the column is called Cash Inflow and not Revenue: If tip or deposits were included, the total for each payment method will be greater than the revenue.
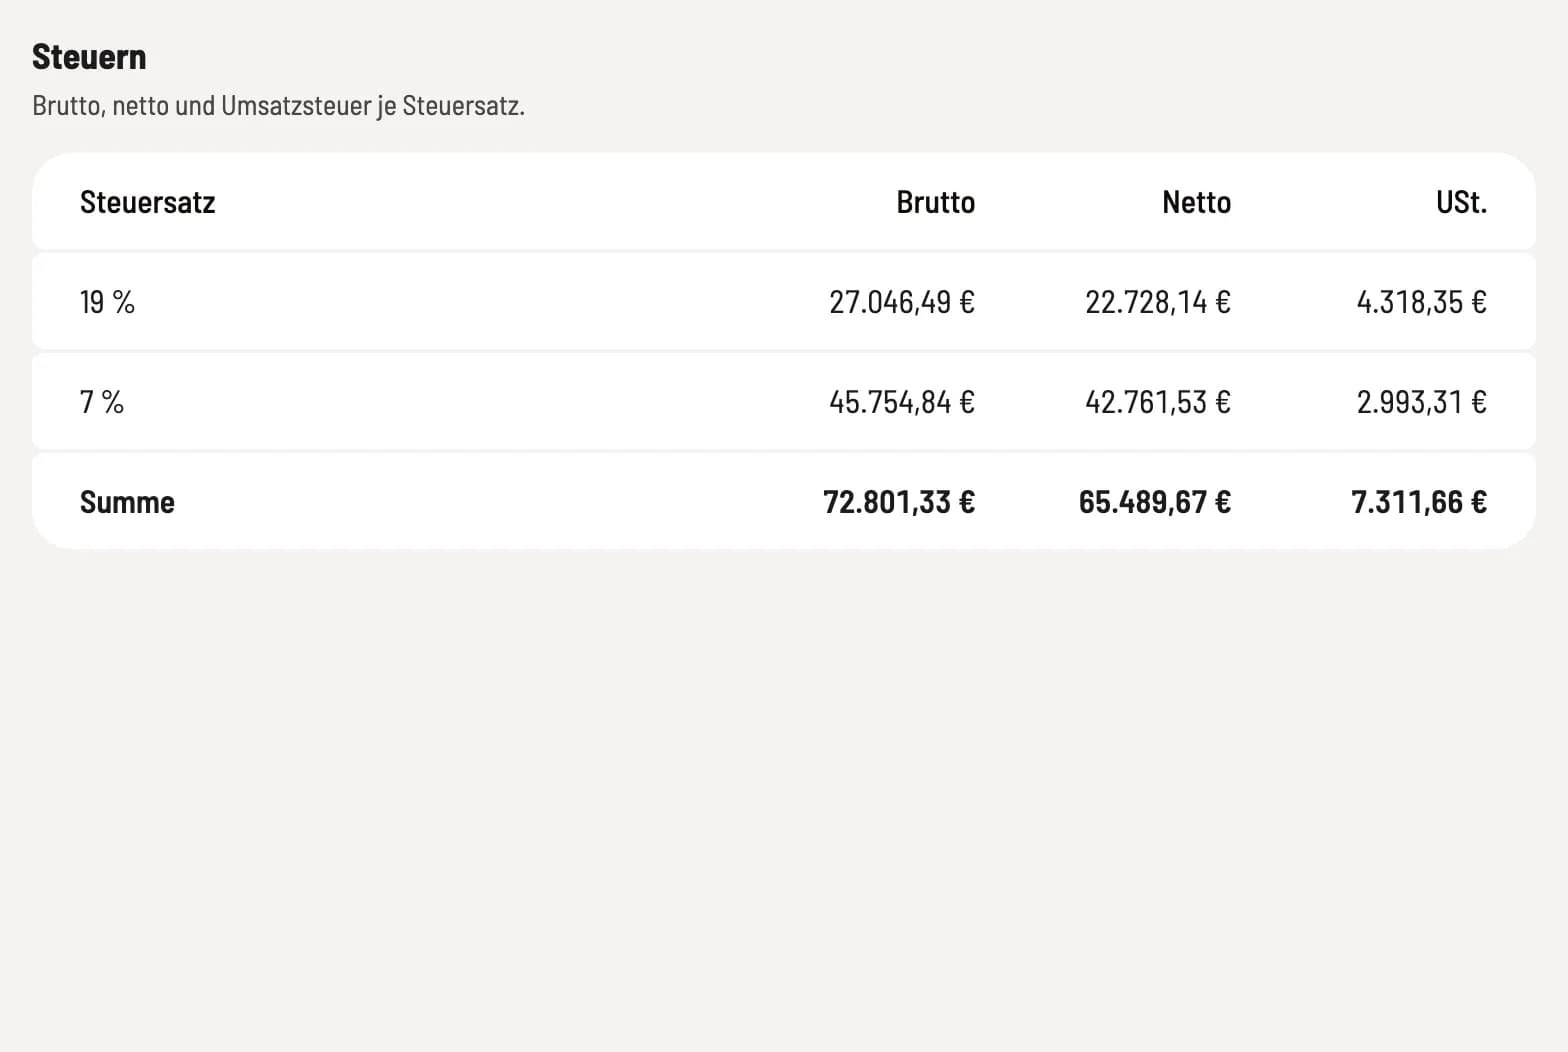
Step 3 of 3
Steer
Gross, net and sales tax per tax rate, as in the Z-report.
Business day
A shift counts towards the day it begins – so a late shift until 3 a.m. counts towards the previous day. The shift already in progress is also included in the count.
With filters
If you narrow down the results, for example to a specific time or channel, the statistics add up the individual receipts. This can differ from the Z-report by a few cents: The Z-report compensates for rounding shift per shift, while a selection of individual receipts cannot.
If you filter by a category, the Sales tile displays the sales of all receipts containing an item from that category. The sales for the category itself can be viewed on the ** item** page.
If a notification appears

… are currently being processed – Servire is processing shifts, for example after setup. The numbers add up automatically.
…could not be processed – the figures are incomplete. Click on Try again. If the message persists, write to us in the support chat.
Older layers were subsequently processed – categories and goods usage then correspond to the current state.